As we started to touch on in last month’s blog post, year three is a magic number in the evaluation journey. The third year is when we see surface level issues, such as risk management, board meetings and agendas, and governance systems and processes, resolving or resolved and the real work beginning for deeper level improvements. This resulted in ongoing increases in the average board evaluation results in years four and five. Boards often describe themselves at this time as being more discerning, strategic, able to have the tough conversations and knowing what they don’t know at this point in their journey.
Our last webinar touched on this as well, our panel of chairs and CEO’s spoke about how they are using governance data to inform their decisions and what their journeys have been like over the last three years. The big take away was that it isn’t about turning every answer of the evaluation into a green, it was about becoming more discerning in their answers and self-evaluations and finding the areas that still needed to be worked on and improved. They didn’t see it as bad thing to have areas to work on, rather a positive that they were mature enough to identify these areas. By taking this approach, the boards are building their own resilience.
Developing governance capabilities and governance resilience seems to go hand in hand, however, you’ve got to be in it for the long haul to see this occur. It’s not just about evaluating once – you’ve got to work on the actions from your results, you’ve got to keep coming back and most of all, you’ve got to surround yourself with the best people to help you grow and succeed.
In this month’s data driven governance insights we wanted to showcase examples of resilience that we’ve seen in our Governance Evaluator Crowd data. For each of the eight key corporate governance modules in our governance evaluation we’ve mapped out the average board answers over five evaluation years and separated these by sector.
Our eight key corporate governance modules are Strategic Direction, Risk Management and Compliance, Finance, Governance Relations, Board Composition, Board Processes, Stakeholder Engagement and Continuous Review and Development. We have data from 10 of our sectors with 5 years of data for Health and Community, 4 years for Water Boards, 3 years for Aged Care, 2 years for Local Government and Waste and Resource Recovery Groups, and for interest, we have also included the following sectors who currently have one year of data so far to show their starting point for Education, Associations, Finance and Sport. Totalling over 480 evaluations with over 5,000 directors results contributing to our Governance Evaluator Crowd.
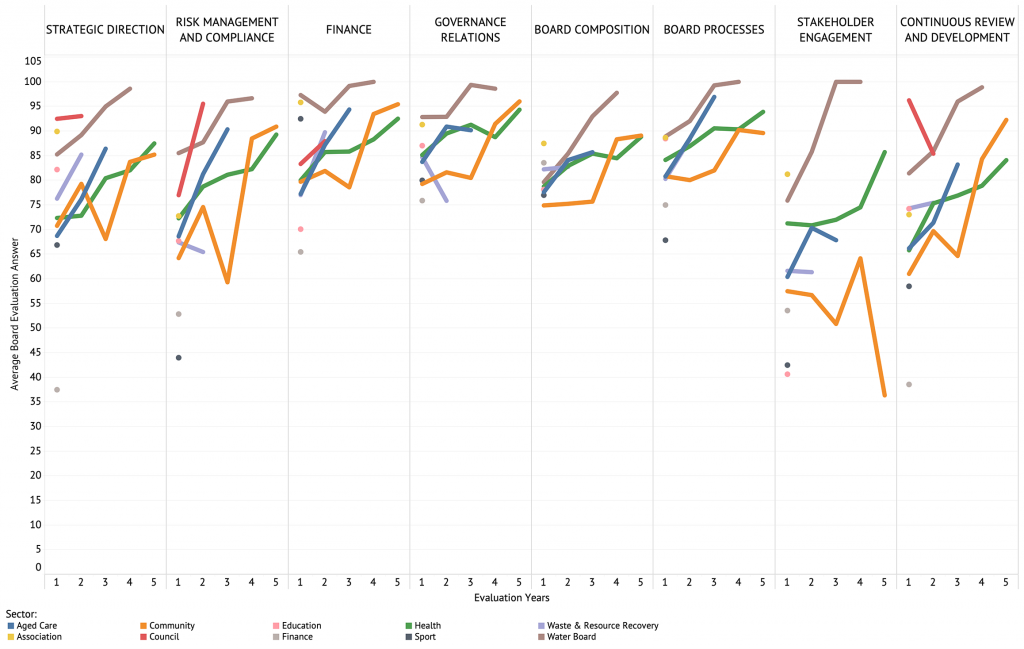
As we can see from the above graph, for all except the last two modules, the 10 sectors all follow a similar path in their results, starting low but over the 5 years increasing. Sometimes this increase is drastic, like in Risk Management and Compliance where we see an average 23% increase in the answers given. In terms of our evaluation scale this would increase the average answers from a yellow to a solid green. Though sometimes the increase isn’t as drastic, like in Finance, where we only see an average increase of 12%, but an increase none the less.
The results are showing for the first 6 modules that the answers are low in the first year, a small increase in the second and subsequent increases in the fourth and fifth year and overall, the answers are clustered closely together.
The interesting part of these results is the great variance in year three, all of the sectors see increases in some modules and decreases in others which would account for why in last month’s data insights we saw a plateau in the overall results for the third year. This is where we see growth in resilience, the boards are becoming more discerning in their answers, they’re having those difficult discussions that our webinar panellists spoke about. The great thing that we see though is after every dip in the average answers across those first six modules, we see a subsequent increase. What this is showing to us is that boards are taking the results from the last evaluation and acting on them. They are working to create an action plan to address the areas that need attention and then over the course of the year completing the areas that they set out for themselves.
The last two modules are completely different, Stakeholder Engagement and Continuous Review and Development do not look similar to any of the other graphs, the sectors are not clustered together – there is a definite spread in the way that these sectors are answering these questions no two sectors were similar in their journey with these modules.
Stakeholder Engagement and Continuous Review and Development were both identified as part of our analysis of 2019’s Benchmark data as two of the top five areas of risk. If you want to see where you’re sitting compared to our 2019 Benchmark data, take our 2-minute survey on Risk Management and Stakeholder Engagement for an instant comparison below.