Our Governance Evaluator Crowd Governance Data is a wonderful resource for evaluating, trending, and benchmarking data that delivers powerful insights into governance.
What we are seeing is that ongoing evaluation produces consistently improving results, more specifically that year three is where the magic happens. Three being the magic number is of no surprise when you consider that in science one must do three experiments to validate results and prove they are replicable for them to be considered true and accurate.
This month we’re excited to share with you our Governance Evaluator Crowd Governance Data to support our claim that three is the magic number in evaluation.
Change in overall average answers to evaluation, over 5 years.
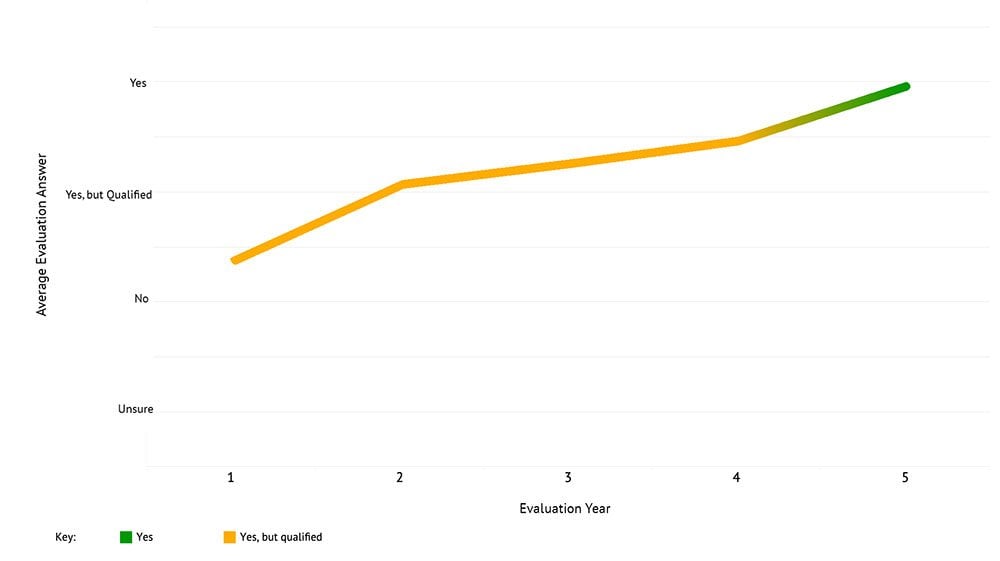
Figure. 1 - Change in overall average answers to evaluation, over 5 years.
This chart shows the change in average answers to the Governance Evaluator Board governance evaluations across five years, totalling over 480 individual Board governance evaluations by over 5,000 directors, councillors and executives.
As shown above, those first few years really are about fixing surface level issues that are illustrated by the initial evaluation data. The turning point in the data is the third year, that is the year where the average answers start to increase. This is suggesting to us that those surface level issues are now resolved and the real work is beginning for deeper level improvement, resulting in average increases in years four and five. Boards often describe themselves as being more discerning and knowing what they don’t know at this point in their journey.
Change in average answers to evaluation over evaluation years, over 5 years.
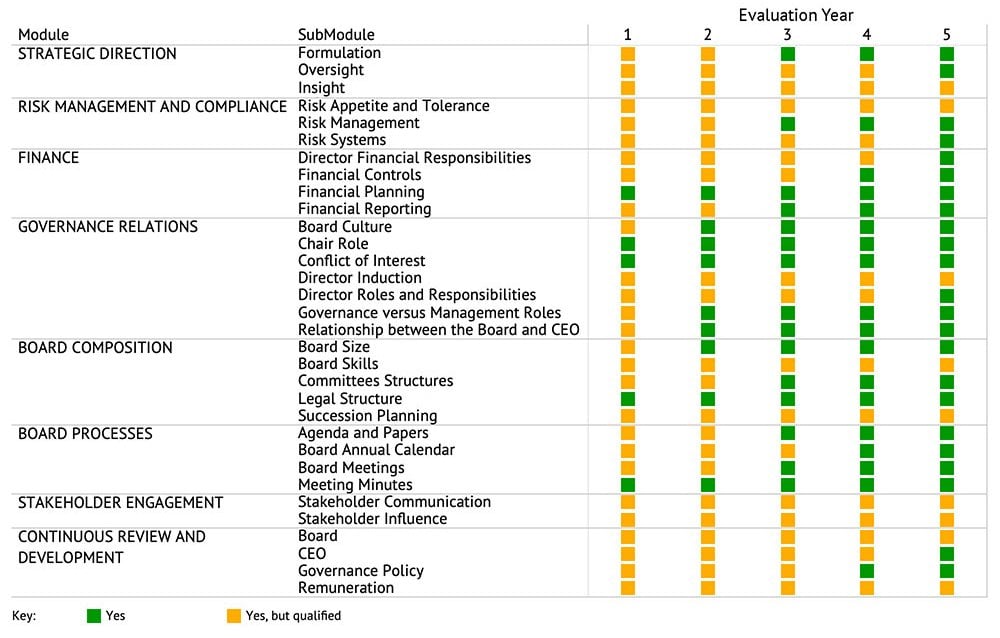
Figure. 2 – Change in average answers to evaluation over evaluation years, over 5 years.
This graph shows the change in average answers to the Governance Evaluator Board governance evaluations core governance modules across five years, totalling over 480 individual Board governance evaluations by over 5,000 directors, councillors and executives.
In the above diagram, we have left out the sector specific modules to focus on the corporate governance areas that effect all boards from any sector. It is clear from our data the real magic appears to be delivered when boards have been engaged in evaluating, trending, and benchmarking their governance data for three years or more.
We would describe the three-year journey of governance evaluation and resulting capability building as the following:
Year 1: Often the lowest results, the evaluation creates a great starting point to identify what boards do not know. Interestingly we had always believed that the first year was one of the higher-ranking years as the directors didn’t know what they didn’t know and thought that they were doing quite well. This again highlights the power of consistently analysed data proving that an initial insight, based on anecdotal and individual evidence, was not necessarily correct for all Boards.
Year 2: A higher result from the Board’s first evaluation as they have become more aware, knowing what they don’t know and have addressed the immediate opportunities that were identified. They describe this as a period of raised anxiety and have a real focus on their governance risk priorities, and the support and resources required.
Year 3: More realistic results which are reflective of the true ‘state of affairs” as the board appears more discerning and developing a stronger focus on what’s required. The results show a plateau as we see no significant increase in ‘Yes’ answers but instead the results are largely consistent with the previous years. This would suggest that they are in the stage where they know what they don’t know and are now working on improving the deeper level issues. Boards often describe this as a true indication of having a culture of review and development and they understand governance is a journey.
However, we can still see that even after five years there are still areas that need improvement and development – no one is perfect and we can see there is opportunity to improve, particularly their stakeholder engagement, induction process, succession planning, strategic oversight and insight, and lastly, their risk and tolerance appetite statement.
Change in average answers to evaluation over evaluation years, over 5 years.
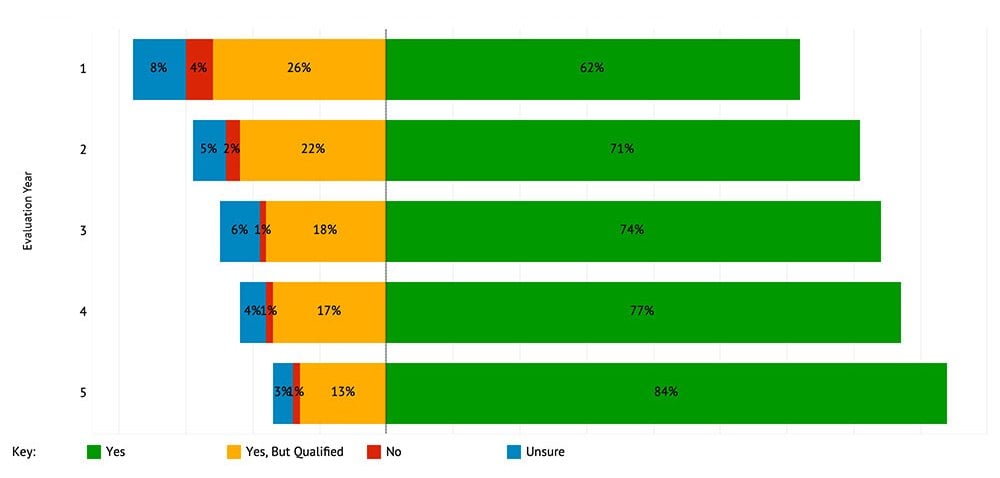
Figure. 3 - Answer change to evaluation over evaluation years, over 5 years.
This chart shows the movement in answers provided to the Governance Evaluator Board governance evaluations across five years, totalling over 480 individual Board governance evaluations by over 5,000 directors, councillors, and executives.
Our graph above breaks down the aggerate answers to the overall evaluation based on our four answers: Yes, Yes but qualified, No and Unsure, across five years. What is interesting to observe over time with these graphs is in year one 40% of the overall answers are made up of Yes, but qualified, No’s and Unsure’ s. However, by the fifth year that is reduced to less than 20%. Evaluation highlights areas that need addressing and that consistent evaluation leads to meaningful and long-lasting positive change, with directors feeling assured that they can answer a full yes in areas that were previously an issue.
What is making an even bigger impact on this three-year journey of awareness is the inclusion of the Individual Director Development and Skills Matrix evaluation. This is enabling boards to have an even broader view of their strengths and weaknesses at an individual and group level. Our data shows that evaluating the individual’s development and skills, as well as the whole board, provides an added dimension in identifying areas for concern and required education, which when acted on, contributes to the overall improvement of the board.
Change in overall average answers to evaluation:
Comparing Boards who complete the Skills Matrix and those who don’t
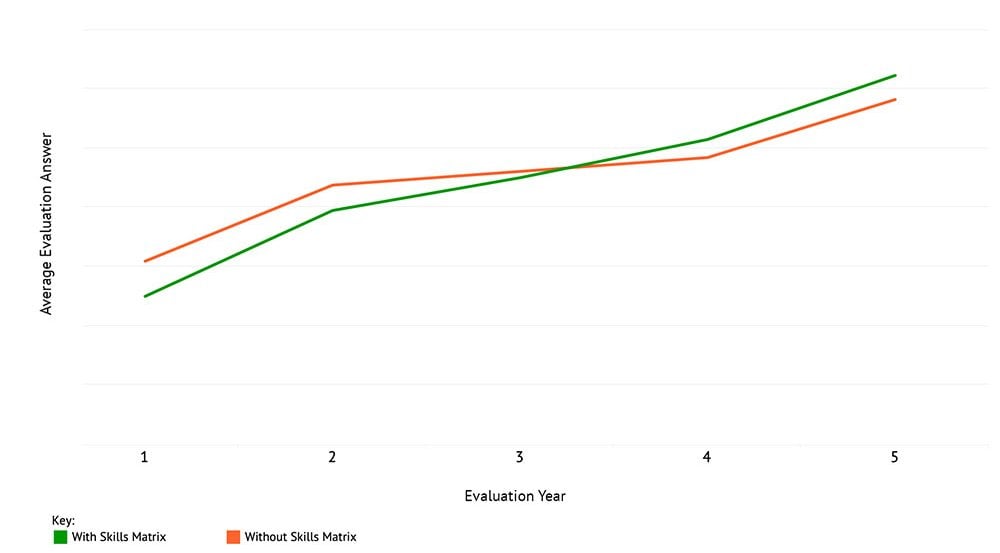
Figure. 4 - Change in overall average answers to evaluation, comparing Board who complete the Skills Matrix and those who don’t
This chart shows the change in average answers to the Governance Evaluator Board governance evaluations across five years comparing the boards answers based on whether they completed the Individual Director Development and Skills Matrix or not. Our results total over 480 individual Board governance evaluations by over 5,000 directors, councillors, and executives.
At three years we see a clear separation in the results in boards who do and do not undertake the individual Director Development and Skills Matrix evaluation, with those who do having better overall results after 5 years.
To talk about starting your evaluation journey and to see the impact of consistent evaluation on your Board contact our governance expert, Fi Mercer.